


The concept of “market mechanics” is the fundamental causes of certain events in the market.
In other words – why at some point the price goes up, down, forms price levels, bounces off these levels or breaks through them.
For clarity, let’s imagine a situation from the real world.
Let’s imagine an ordinary grocery market where there are two sellers – Andrew and Bill. Both sell potatoes, the same, no different from each other. Andrew’s potato stocks are 100kg, he bought it a long time ago at low prices for $0.5/kg. Bill’s stocks are 10kg, he recently visited the market and bought it from the nearest wholesaler at a price of $0.7/kg. Imagine that the average retail price for potatoes in the region is $1 per kg. Since Andrew has a lot of potatoes and his task is to sell it more, he is ready to put it up for sale at a price of 0.9$/kg – this is an excellent price for him, since selling it for Andrew will earn 80% of the invested funds. Bill set the price at $1, hoping to sell it and earn about 42% of the initial investment.
The First Situation
Vivian’s buyer comes to the market, who needs 10kg of potatoes. She sees the best price from Andrew and, since both sellers have the same potatoes, buys from him. The deal took place between Vivian and Andrew at Andrew’s price of 0.9$/kg. And Bill, as he stood with his volume and the price for sale, continued to stand. Thus, as long as buyers do not buy all the potatoes from Andrew (and this is 100 kg), the price will not move from the $0.9/kg mark.
The Second Situation
Harry’s buyer came to the market, who needs 150kg of potatoes. He will first buy all the potatoes from Andrew at a price of $0.9, then another 10kg from Bill at a price of $1, as a result of which the current price of potatoes in this market will shift and amount to $1/kg. After seeing such a situation the seller Iten from the neighboring village (trader-arbitrageur) quickly brings his stocks to the market and sells the remaining 40kg to Harry at a price of $1.5/kg, thereby raising the price by one and a half times.
As the demand for potatoes increased, the demand pushed the price higher, sellers Andrew and Bill urgently bought more potatoes from wholesalers at an average price of $0.8/kg: Andrew 100kg and Bill 20kg (Bill decided to invest the money earned from the last sale in a new purchase). Andrew put the price at $1.5, and Bill, this time decided to cheat and put up $1.4, so as to be the first on the market at the price.
The Third Situation
Harry’s big buyer comes to the market again, this time he needs 50kg, but this time he is no longer ready to buy at such prices, he stands in front of buyers with a sign “Ready to buy at $1” (limit order to buy). There is a lull in the market – no one is ready to buy or sell – for the buyer the price offered by the sellers is too high, for the sellers the price offered by the buyers is too small. Bill is the first to break down, because he has not yet earned anything from the market, but only invested, and decides to sell his 20kg at least for $1 in order to take something away from the market. After that, a new market price of $1 is set on the market. Since there are no more buyers, Andrew also decides to sell Harry at least a part at his price, and sells the 30kg he needs. Andrew also exposes the remaining 70kg at $1. There are no more buyers on the market and, out of a desire to interest at least someone with his goods, Andrew lowers the price to $0.8 in order to sell off the remnants at the purchase price and leave with a breakeven on this deal. As soon as the first buyer who bought at this price from Andrew appears on the market, a new market price of $0.8/kg will be established on the market.
The most important conclusions from the described examples:
- The price is pushed by real buyers and sellers with their market orders (not limit orders). That is, the current market price is set by the market participant who executes someone’s limit order (agrees to its price). The offers of sellers Andrew and Bill in the form of price tags over their goods are limit orders, they are waiting for buyers who will execute their orders. The buyer Harry, having put up a sign “Ready to buy for $1”, is also a limit order. But the buyer Vivian, having bought, made a market order, executing Andrew’s limit order at the best price. Like Bill, who freaked out and initiated the sale of Harry himself in situation 3.
- The price will not budge until the entire volume put up for sale (or purchase) at the current price is realized. This is how the price level is formed on the chart, the price hits the wall (a large limit volume) and bounces off. As soon as this “wall” (this volume) is sold out by buyers, the price will move higher and, thus, a breakout of this price level will occur. Many who were waiting for this breakout, having seen a sufficient profit in the trade for themselves, will begin to close their trades (that is, sell with market orders) – this is how the first pullback is formed after the breakout of the price level, often reaching the most broken price level (return). Those who did not have time to buy at the time of the breakout will start buying, thereby forming the first rebounce from the price level after its breakout. This is the principle of forming a classic true level breakout and subsequent movement after the breakout.
- The price can make unexpected movements, destroying any expectations, patterns and formations. There are millions of participants in the market, each of them has its own volume in the trade, its own opening price, expectations, trade targets and psychology. There are large participants who are able to move the price in one direction or another with their volumes and manipulative actions. There is a crowd that, succumbing to panic or greed, can also bring down or raise the market with its total volume of trades. This is what the so–called “crowd psychology” looks like, and evaluating movements, price levels, trend lines, candlestick formations, etc., it will not be superfluous to ask questions - “How does the crowd see it?”, “How will the crowd react to it?”, “Isn’t it a manipulation of a major participant and what is his next step?”.
MARKET PARTICIPANTS
- Buyers and sellers
In the example above, we have clearly demonstrated the work of these participants. We will only note once again for consolidation that there are limit sellers/buyers and market ones. Limit sellers/buyers place their limit orders in the order book and wait for their execution at the price they set. And the market ones work with market orders executing limit orders of the former.
- Exchange
This is the market itself, a platform where buyers and sellers meet. The more participants there are in the market (exchange) and the more volume these participants trade, the better for the exchange, because the exchange, as a business, earns commissions from each completed transaction. Exchanges by and large do not care what happens in the market, they always earn, as long as the participants trade with each other.
- Market Makers
The function of market making can be performed both by the exchange itself and by a separate company or person. The essence of this role is to provide liquidity in the market, that is, to provide such a volume of assets for sale and purchase so that market participants can realize their purchases and sales without significant price changes. It is usually quite easy to notice it in the order book in the form of fairly large limit orders at some distance from the current price from above (sellers’ order book) and below (buyers’ order book), these orders are usually equal to each other in volume. With their orders, market makers keep the market from sudden impulse price movements.
- Correlators
Their task is to ensure that prices match on different markets, different exchanges, between the spot market and derivatives (futures, options). This is a robotic tool and at some moments (in moments of increased volatility) they are turned off, which gives enormous opportunities to earn money on this type of market inefficiency.
- Bots
All of the above roles can be automated with the bots, so this type is already on our list, but here we highlight a special participant – an algorithm that can also create a rather strong inefficiency of the market. For example, a bot-buyer - with some frequency (for example, once every 2 seconds for 15 minutes) buys a certain asset with market orders, then turns off or “flips” in the opposite direction and starts selling the same way. Or a substitute bot is a robot that pushes the price up by constantly substituting its limit order with the very first in the spread, as soon as someone puts their limit order higher, he removes his order and rearranges it even higher (a very common manipulation). There are many more different options, we will discuss them in more detail in the strategies BOTS & MANIPULATIONS OF THE MARKET. It’s just important to understand that in addition to people, there are also algorithms on the market that can also be manipulated, noticed, earned with or against them.
WHAT INFLUENCES THE CRYPTOCURRENCY MARKET?
In addition to the market interactions between participants described above, it should be understood that the cryptocurrency market is not in a vacuum and external factors also affect it. For the scalping style of trading, these factors are secondary, but for a general understanding of what to expect in the market during the day or week, they must be taken into account.
At the moment, the cryptocurrency market has long been of interest not only for crypto-geeks and household small speculators, but also for large investors, companies, funds and even governments. This is a trend and now it’s just the beginning of it. Such large participants definitely influence the market: positively, when it becomes known that another fund has purchased BTC for X money; and negatively, when large holders begin to throw off their crypt.
From the point of view of a large investor who is used to diversify his capital, distributing part of the investments in shares of American companies from the top 500, part in gold and other metals as a reliable part of the portfolio, part in fast-growing high-risk markets, as a risky part of the portfolio, part in the crypt. And today, investments in crypto belong to the category of high-risk investments. You can already guess why crypto refers to high-risk investments – volatility. And, if the global economic situation or the economic situation in a country (for example, the United States) worsens or even there is a hint of its deterioration, then such investors first of all get rid of high-risk assets.
Therefore, it is extremely important, when trading on the crypto market, to understand the situation in external markets. Next to the BTC-USDT chart, which is the main guide in the crypto trading, you should also keep a chart of, say, the S&P500 index (ticker SPX) in front of your eyes.
It is also a good idea to know the dates of the next meetings of the US Federal Reserve (Federal Reserve System) and follow the results of their meetings. At such moments, when the next funding rate is announced, all markets are activated – the American stock market, and after it the crypt. And as you already know, volatility is good for a scalper, which means these are the moments when you can make good money, close a previously opened position or open a new one.
Various geopolitical events can also influence. A very recent example is the situation in Kazakhstan, military conflicts, etc. The ban on mining in China forced local miners to migrate. Kazakhstan welcomed them with pleasure. And then what happened happened, the Internet was turned off in Kazakhstan and all mining capacities stopped, as a result of which the network power (hashrate) began to fall, which, of course, affected the market. So it is also necessary to be aware of global news.
Another factor affecting the market that should be taken into account is time (seasonality and time within the day). Markets behave differently, say, at the beginning of the year and in summer, in the morning or in the evening. Despite the fact that the cryptocurrency market operates around the clock and 365 days a year, it is also influenced by the work schedule of institutional investors with their vacations during the year, as well as the periods of trading sessions on the American or Asian markets. Read more about this in the article “SEASONALITY AND PATTERNS WITHIN THE DAY”.
MARKET PHASES
There are only two phases in the market: balance and momentum.
- Balance
– aka flat, range, * saw* – when the price makes minimal movements, there is weak volatility in the market, a lot of manipulation. In this state of the market, it is better not to trade at all. Being able not to trade is the most important skill. There are only two approaches to trading in such phases that can be considered: these are bounces from the borders of the price range and the exit (breakout) of one of the range borders. But, because such a market, as already mentioned, is characterized by a large number of manipulations, then bounces can not reach the borders or pierce them, and breakouts can quickly return forming false breakout. Read more in the strategy “TRADING IN THE RANGE” (7 ready-made strategies for the price range).
- Impulse
– aka trend or distribution – the directional movement of the market in one direction (up / down). Someone in the price range was gaining a trade position in the long, someone in the short, someone of them turned out to be stronger, a breakout occurred, new participants entered in the direction of the breakout, throwing the price higher, who was gaining a position in the opposite direction begins to close losses, thereby throwing the price even higher, etc. – this is how it is formed directional movement. This is the most favorable phase of the market for trading, the movements are amplitude, with increased interest of market participants, it gives a lot of trading situations – TRADING ON TREND, BOUNCES STRATEGIES, BREAKOUTS STRATEGIES, VOLATILITY & SPREAD TRADING, CATCHING A KNIFE STRATEGIES.
More clearly about how the nature of the market movement looks like:
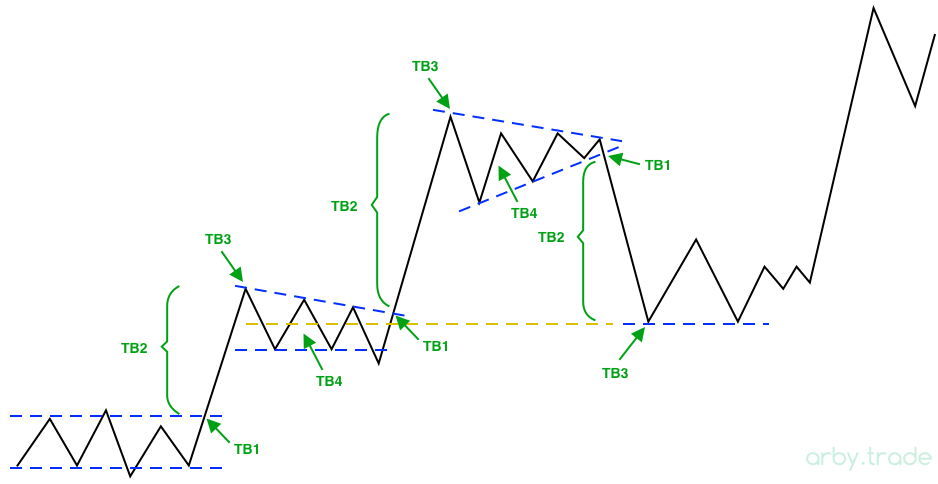
Point 1: Exit from price range – breakout of the price range border
Point 2: Impulse – working with rebounces, breakouts in the execution of large limit orders, trading inefficiencies, rearranging large limit orders, volatility trading.
Point 3: Trading of rebounces – corrections from local highs, reversal patterns, working from large limit orders, catching knives (point 3 is at the beginning of the movement – the place where you need to go when catching a knife).
Point 4: Trade within price range - work from the borders, with large participants within price range. The area with the least potential in the trade.
MARKET DIFFERENCES
All markets are fundamentally the same – the psychology of the crowd and the actions of the participants are the same. There is only one difference – liquidity and, as a result, volatility. All trading situations, patterns, formations and trading strategies are equally worked out everywhere and on any timeframe, with the exception of some nuances. Therefore, all the knowledge and best practices can be applied equally successfully not only in the cryptocurrency market, but also in the stock market, not only in scalping, but also in medium-term trading.