– The “blood transfusion” of the market
Liquidations are one of the key elements that define the behavior of the cryptocurrency market — they represent the forced closure of losing positions held by traders, which can trigger chain reactions and radically alter the price trajectory. In this article, we will dive deep into the phenomenon of liquidations, starting from the basic concepts and moving on to their use in personal trading as potential entry points, trading strategies built around the liquidations of other participants, as well as a tool that helps filter and identify the most promising market situations for trading these strategies. We will examine why liquidations occur, how they are implemented on exchanges, the hidden pitfalls, manipulations, patterns in price behavior, and ways to monetize this phenomenon. The article is based on real market mechanics, data from Binance, Bybit, and other platforms, as well as analysis of historical events such as the FTX collapse in 2022 or “Black Thursday” in 2020, and our own experience trading these situations.
1. WHAT ARE LIQUIDATIONS ON THE CRYPTO MARKET
A liquidation is the forced closure of a losing trader’s position by the exchange when the loss exceeds the available margin balance. Imagine taking a loan from a bank to buy stocks, but the stock price falls so much that the collateral (margin) is no longer sufficient to cover the loss — the bank then sells your stocks to recover the debt. On the crypto market, this happens automatically and instantly, thanks to the leverage system (borrowing funds from the exchange to increase position size).
We discussed the leverage system, the difference between spot and futures trading, and the concept of leverage (credit shoulder in futures) in the previous article on funding.
Why Do Liquidations Happen?
Liquidations are a consequence of margin trading using leverage. Traders use it (for example, x5, x10, or x100) to trade larger volumes than they actually have money for. If the price moves against the position, losses grow exponentially (leverage multiplies risks just as it multiplies potential profits). The exchange liquidates such positions to protect itself from potential losses (since it provides the loan). Without this mechanism, the exchange risks bankruptcy, as happened with FTX, where uncontrolled positions led to the collapse and shutdown of the entire exchange.
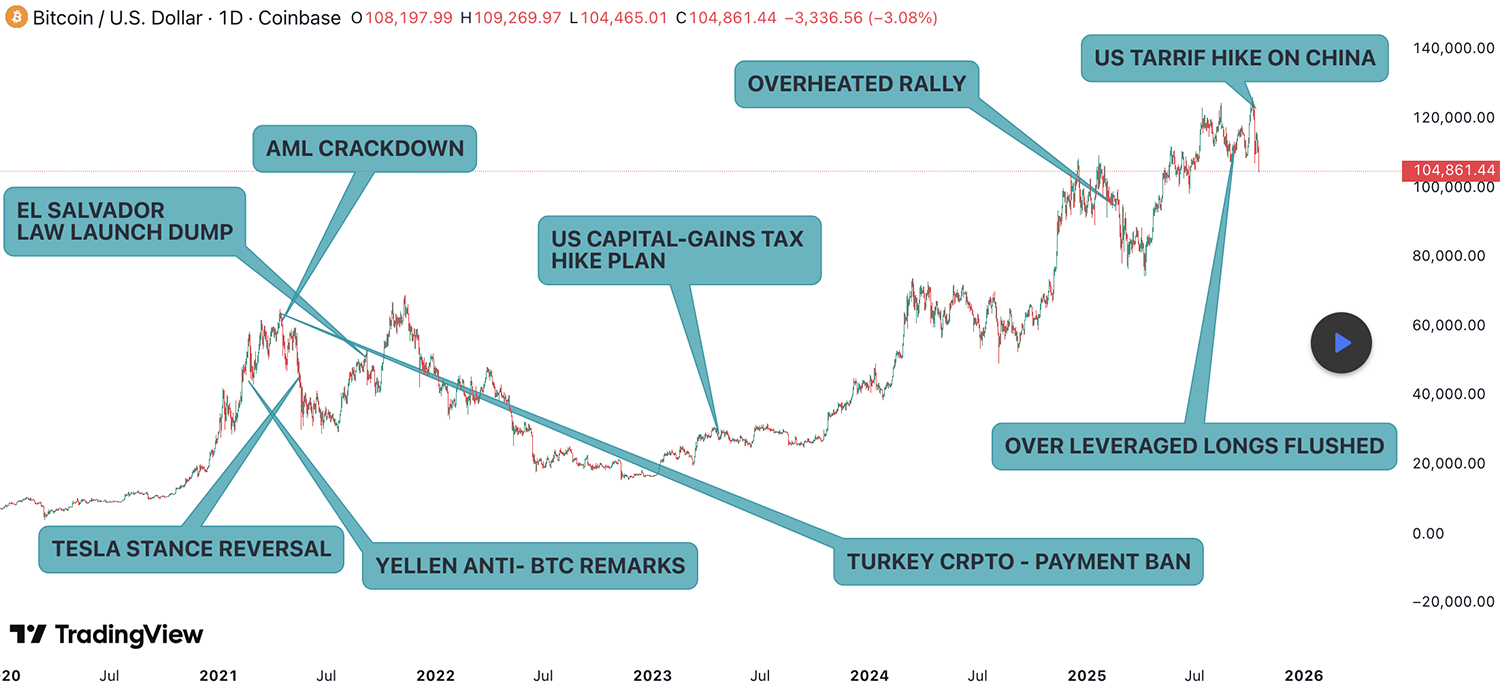
The phenomenon emerged with the development of crypto futures contracts. The first massive liquidation occurred in 2017–2018 on BitMEX, where perpetual futures (perpetual contracts) were introduced. Since then, liquidations have become the norm: in 2021, during the BTC crash from $69k to $30k, $10 billion was liquidated in a single day.
How Is It Implemented on the Exchange?
- Margin and Leverage: When opening a futures position, you deposit the initial margin (for example, 1% of the position size with x100 leverage). The maintenance margin is the minimum required to keep the position alive. With x10 leverage, the margin is 10% of the position volume — for instance, $100 is sufficient to open a $1,000 position using x10 leverage.
- Liquidation Price – the price at which a losing position will be forcibly closed by the exchange: It is calculated using the formula:
⦁ For a long position: [Entry Price] - ([Margin] / ([Position Volume] * (1 + Maintenance Margin Rate)))
⦁ For a short position: [Entry Price] + ([Margin] / ([Position Volume] * (1 + Maintenance Margin Rate)))
⦁ Maintenance Margin Rate – the coefficient for the maintenance margin. When the “risk metric” reaches a critical level, liquidation is triggered.
⦁ The exchange monitors the liquidation price in real time. - Process: When the price reaches the liquidation price, the exchange sells or buys your position at market price. This can cause slippage — the price moves further away due to your own order.
- Fees: The exchange charges an increased commission for liquidation (0.1–0.5%, depending on the platform).
Hidden Pitfalls and Non-Obvious Aspects
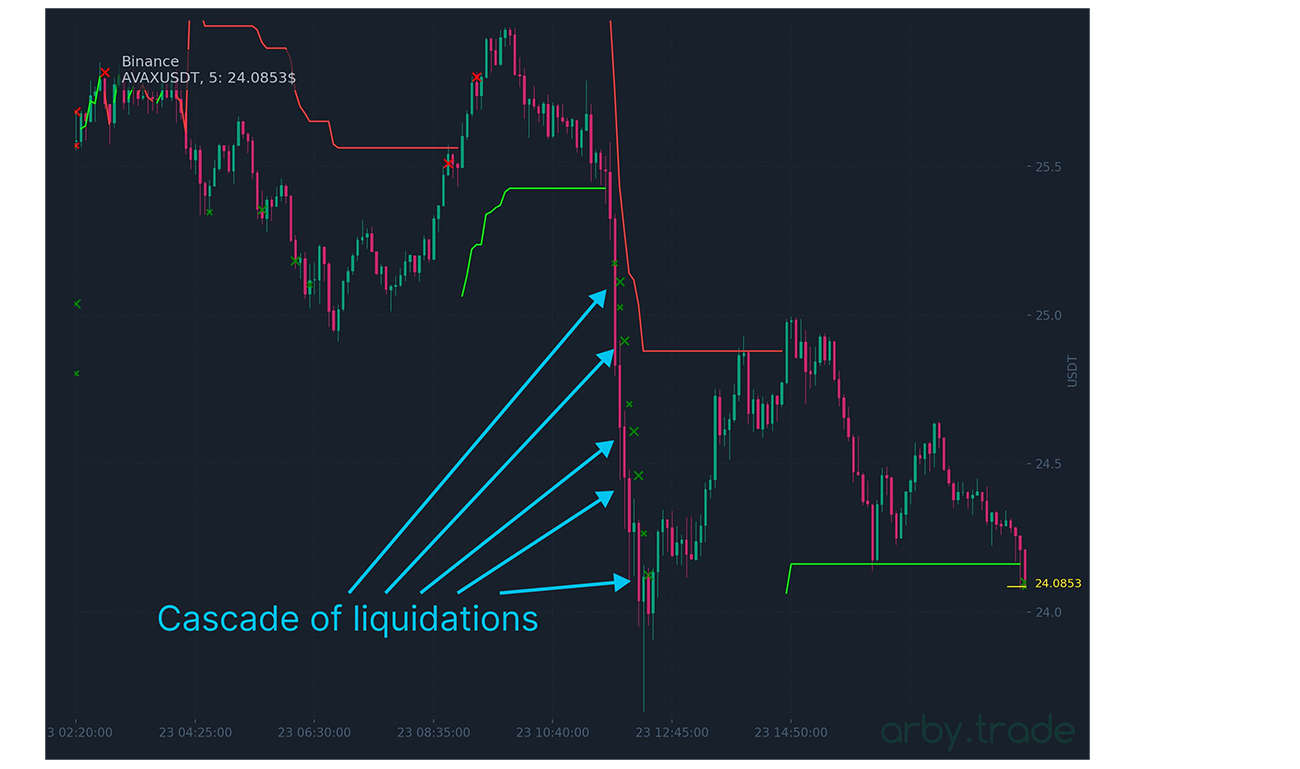
• Cascading Liquidations:
One liquidation triggers others, creating a chain reaction — the price falls or rises sharply. In 2022 on Solana, $500 million was liquidated in an hour, causing a flash crash.
• Funding Rate:
In futures trading, traders pay or receive funding based on their open position (see the previous article on funding). High rates (0.5–1% per hour) “eat away” at the margin, bringing the liquidation price closer to the entry price.
• Cross vs. Isolated Margin:
When using cross-margin, the entire futures account balance serves as margin for each open position, resulting in higher risks. With isolated margin, each individual trade has its own independent collateral — the liquidation price is closer (since less margin is involved), but the risk of losing the entire deposit is eliminated.
• Liquidation Price – Based on Mark Price, Not Last Price. Many are surprised: “Why was I liquidated when the chart price barely reached that level?” This is because on many exchanges, liquidation is calculated using Mark Price, not Last Price. Mark Price is a “fairer” price derived from an index/basket of sources, designed to reduce the impact of manipulative spikes. In simple terms, it is an average price across different exchanges, not just the one where the position is open. Binance explicitly states that the liquidation price and PnL are calculated using mark price, and that mark and last prices can differ.
• Slippage: With a large position, the exchange may “take” more than expected. An important nuance: a losing position is not always liquidated exactly at the specified liquidation price, as the exchange protects itself from excessive slippage. If a significant volume of positions needs to be liquidated at once and there is a risk that current liquidity may not be sufficient to execute all liquidations (someone has to buy/sell them), the exchange may start liquidating losing positions slightly earlier — at a higher price for longs or a lower price for shorts. As a result, a position can be liquidated without even touching the indicated liquidation price.
Understanding these nuances will save your deposit: always leave a margin buffer (20–30% above the minimum) and avoid over-leveraging, especially if you are still new to trading.
2. MARKET MAKER PARTICIPATION IN LIQUIDATIONS
A Market Maker (MM) — эis a market participant who provides liquidity for an asset by constantly placing buy (bid) and sell (ask) orders for a specific asset. In simple terms, it’s like a “trader” at a bazaar who is always ready to buy your goods at one price and sell them at a slightly higher price. The market-making function can be performed by the exchange itself or (more commonly) by a separate company that handles this role for a particular asset.
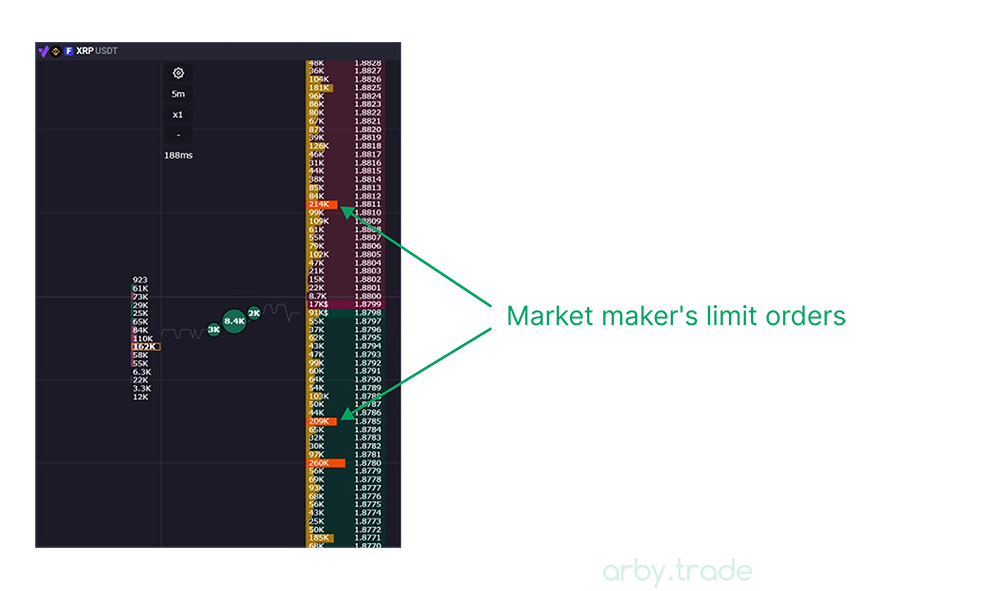
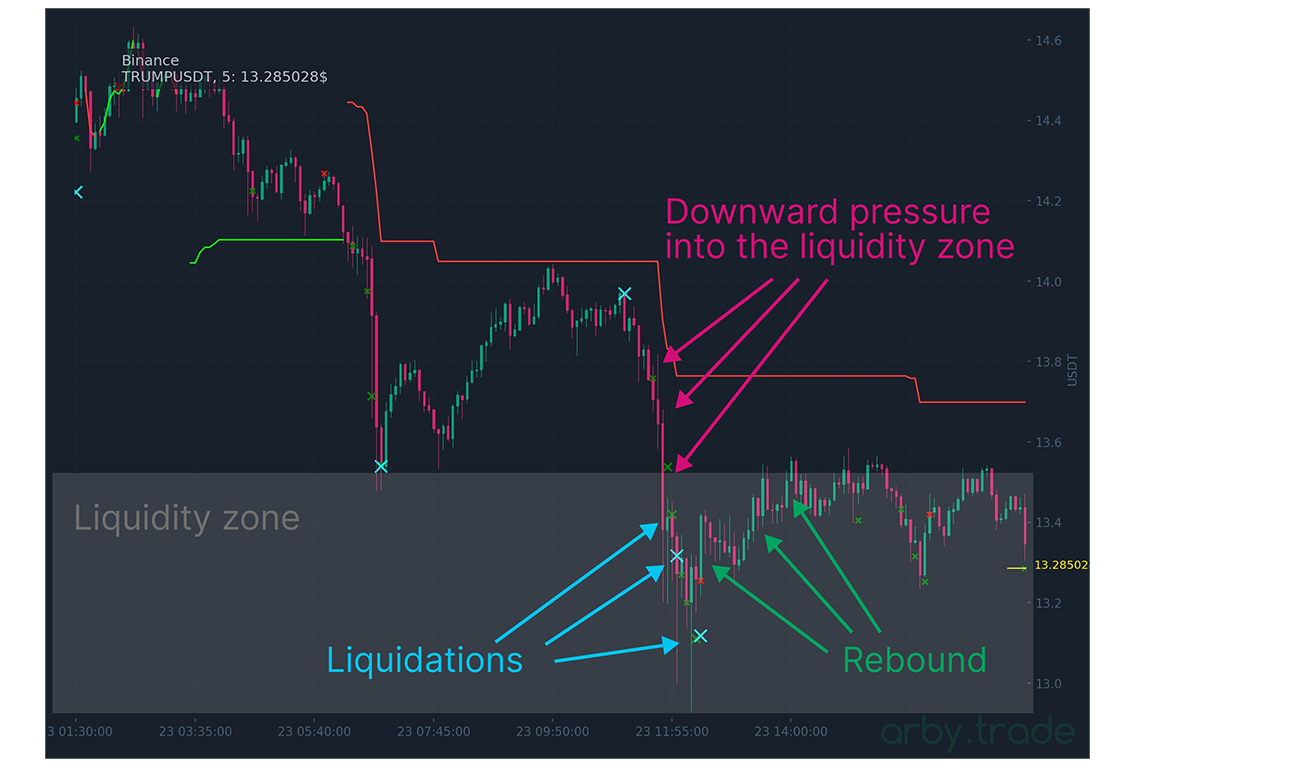
A responsible MM, while performing its function of maintaining asset liquidity, is forced to “absorb” the liquidations of retail traders. As a result, the MM accumulates a significant bought volume, and to get rid of it and restore balance, it has to push the price higher, where it will unload. This mechanic explains the frequent rebounds from liquidation zones: a sharp dump downward followed by liquidations, then a sharp rebound upward. All of this applies to liquidations of long positions (for short positions, it’s the mirror opposite) and to a responsible MM that truly supports asset liquidity. This mechanic creates the foundation for one of the trading strategies based on the liquidations of other participants and the actions of the market maker — in simple terms, to capture the rebound move together with the market maker, but more on that a bit later.
However, you can also encounter different MM behavior. When panic (or euphoria) reigns on the market and liquidity levels and zones are swept away one after another — in such moments, the risks for the MM become very high to absorb liquidations in such volume, so the MM may simply disappear from the order book until the market finds a local bottom (or high). Or there is behavior where the MM (or any other large market participant) manipulates the price, deliberately pushing it into liquidity zones (unloading “toxic” volume, building positions, etc.). More on that further.
3. MANIPULATION MECHANICS: HOW WHALES DRIVE PRICE TO LIQUIDATION ZONES
Liquidation zones are often used by large market participants as areas where they can close their positions or, conversely, open new ones. These zones — liquidity zones — are price areas where most retail traders place stop-losses and where liquidation clusters accumulate. The triggering of stop-losses and liquidations generates market sells (for long positions) or market buys (for short positions), i.e., trades executed as market orders. This is precisely what creates impulsive price movements during level breakouts, wicks, or general market declines/rises.
These areas are often quite obvious, and some platforms provide data on liquidation clusters. This, in turn, creates a whole field for various price manipulations aimed at “collecting liquidity” — either to exit positions or, conversely, to enter them.
How Does It Look?
- Accumulation of Stops and Liquidations:
Exchanges publish data on OI (open interest) and liquidation heatmaps (e.g., on Coinglass). Whales see clusters of stops and liquidations. - Preparation:
The whale opens a position in the opposite direction (short if hunting for long stops and liquidations). - Price Drive:
Through their sells, the whale pushes the price toward the cluster: large orders on spot and/or futures. - Liquidation:
Then retail traders get stopped out or liquidated — their orders execute, giving the whale profit, as they have orders placed in these areas to close their positions (or conversely, to open new ones if the goal was to accumulate volume at better prices). - Reversal:
If the volume of stops and liquidations is insufficient to satisfy the whale’s unloading volume, they may start closing the remainder of their position at market. Thus, the price reverses — creating a rebound move from the liquidity zone, and the whale locks in profit.
This is just one example of how a large participant, manipulator, or market maker can use liquidity zones for their purposes. A similar process occurs when a whale, on the contrary, wants to accumulate a large position at better prices.
Benefits
• For Whales: Buy low, sell high. Liquidations provide “free liquidity” — the whale buys assets from liquidated traders at low prices.
• For Market Makers: They provide liquidity to the exchange and receive their rebates. Hunting liquidity zones is a way to generate volume and rebates from exchange commissions.
• For Exchanges: More volume and trading — more fee revenue.
4. PRICE BEHAVIOR PATTERNS DURING LIQUIDATIONS
Liquidations act as “fuel” for price movement. Key patterns include:
• Impulse and Reversal:
A liquidation triggers an impulse — the price accelerates, but then reverses by 30–70% of the impulse.
• Cascading Liquidations:
1) Small liquidation (<$100–500K), movement 1–3%. 2) Medium ($500K–10M), movement 3–5%. 3) Large (>$10M–100M+), movement 5–15%.
• Volume Surge:
On the impulsive candle with liquidations, there is a multiple increase in average volume by ×10–50 — an indicator of reversal.
• Cascade – Climax – Reversal:
A series of liquidations, acceleration, then slowdown of the fall, a base appears, and the market reverses.
• Squeeze and Continuation:
Short liquidations fuel upward movement (short squeeze), long liquidations fuel downward movement (long squeeze). In a trend, it often acts as an “accelerator”. This is especially visible during anomalous pumps of coins (short squeeze) and during total market panic when everything falls without pullbacks (long squeeze).
5. LIQUIDATION VOLUME
A key parameter when analyzing a market situation for potential trading opportunities.
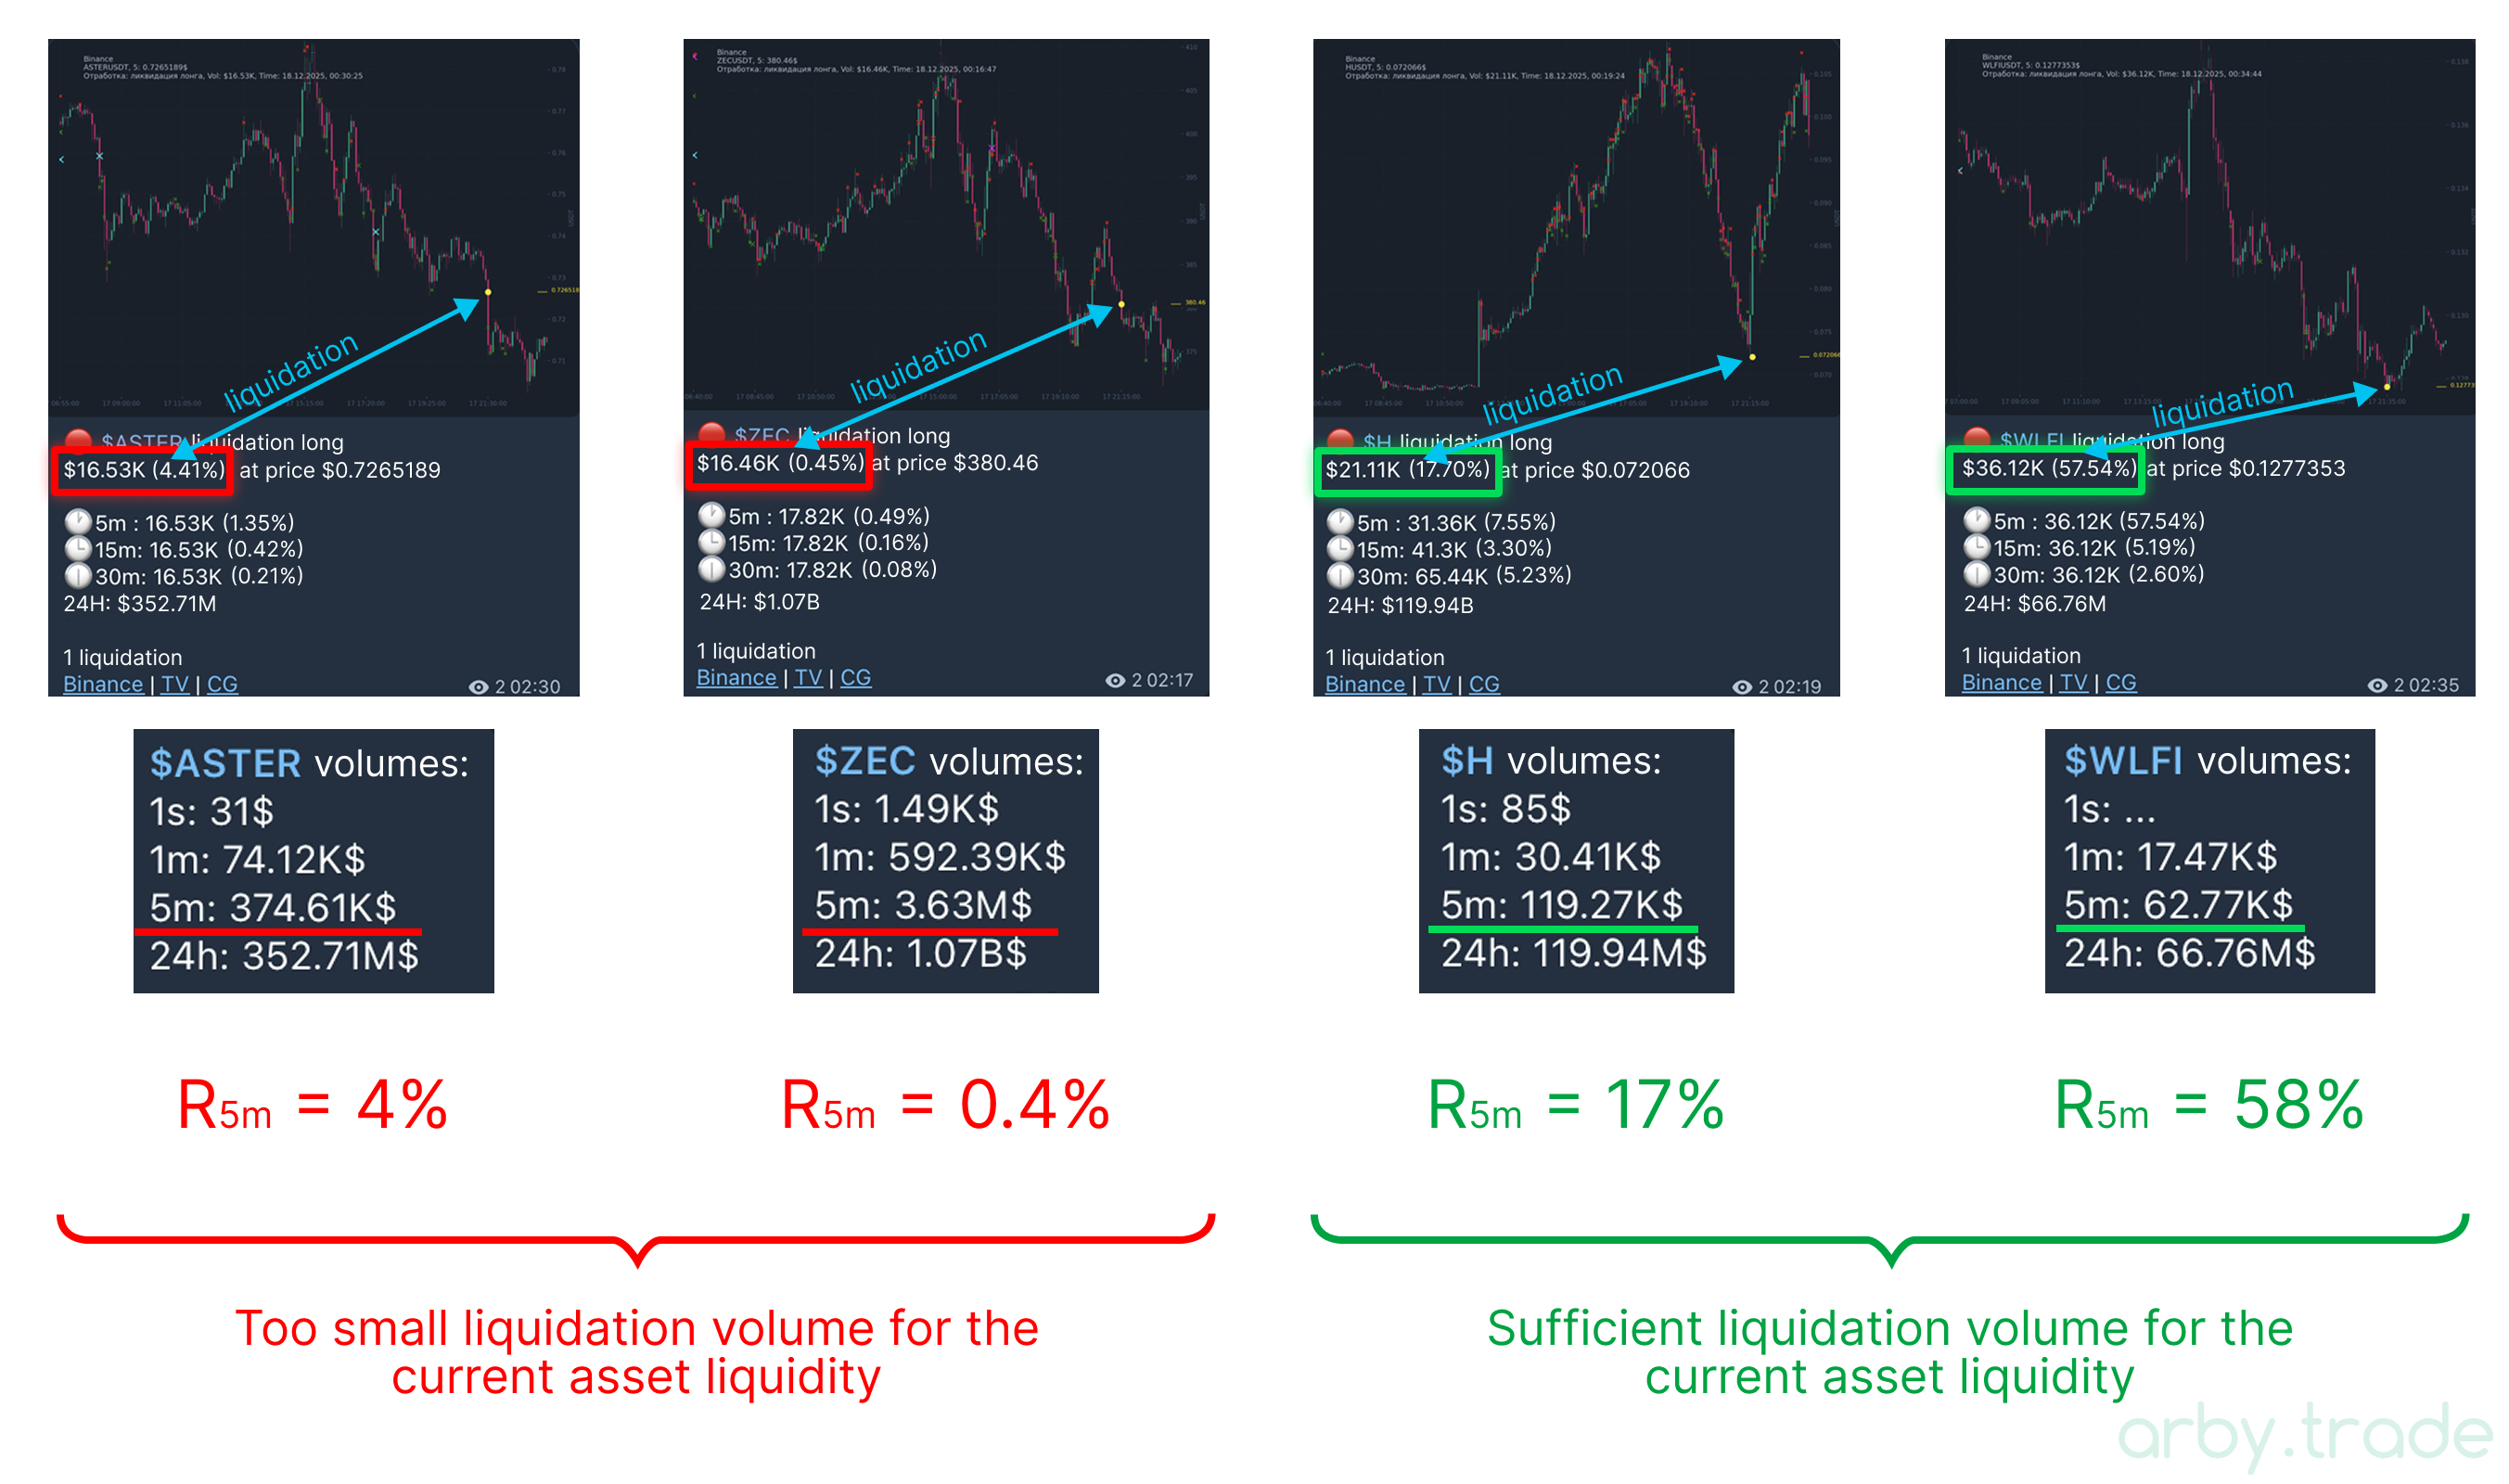
When analyzing liquidation volume, it is necessary to consider the overall liquidity of the asset where the liquidation or cascade occurred. For example, a $5K liquidation on a coin with a minute trading volume of $50M is practically nothing. But a $50K liquidation on a coin with a minute trading volume of $200K is already an event.
When determining the significance of a particular liquidation volume, you can also refer to the daily trading volume of the asset. For example, if the daily volume is $100M, the average minute volume will be approximately ~$70K, and the 5-minute volume — $350K.
In general, the larger the liquidated volume, the stronger the potential situation for trading. In this regard, it is better to focus not only (or not so much) on the volume of a single liquidation of some trader, but on the total volume of all liquidations, for example, over the last 5 or 15 minutes — this allows for a better understanding of the current situation on the asset, the real total liquidated volume, and making a decision.
Therefore, when analyzing situations, it is desirable to evaluate the ratio of the total liquidated positions over a unit of time (e.g., 5 minutes) to the total trading volume on the coin (e.g., over the same 5 minutes). The formula is simple:
R_5m = L_5m / Vol_5m * 100 (%)
L_5m – liquidation volume over 5 minutes, Vol_5m – trading volume over 5 minutes, R_5m – the ratio of liquidation total to overall trading volume, expressed in percent.
• R_5m < 1% — usually noise (unless it’s a microcap or super-thin order book)
• R_5m ≈ 2–5% — significant, can be considered as context/trigger (with confirmations)
• R_5m ≈ 5–10% — strong, often cascade/liquidity sweep
• R_5m > 10% — extreme, often climax/local trend change
• R_5m > 20–30% — rare “meat grinder”, but happens on low-liquidity assets
In other words, you need to see that the liquidation volume occupied a noticeable part of the total traded volume.
If giving a rougher estimate, for BTC/ETH liquidations below $500K are noisy and not particularly interesting, while from $1–10M+ they become more noticeable.
For TOP-50 alts: below $100K — noise, from $300K–1M already noticeable.
For other low-liquidity or recently listed coins: below $10K — noise, from $50–100K already noticeable.
6. TRADING STRATEGIES BASED ON LIQUIDATIONS
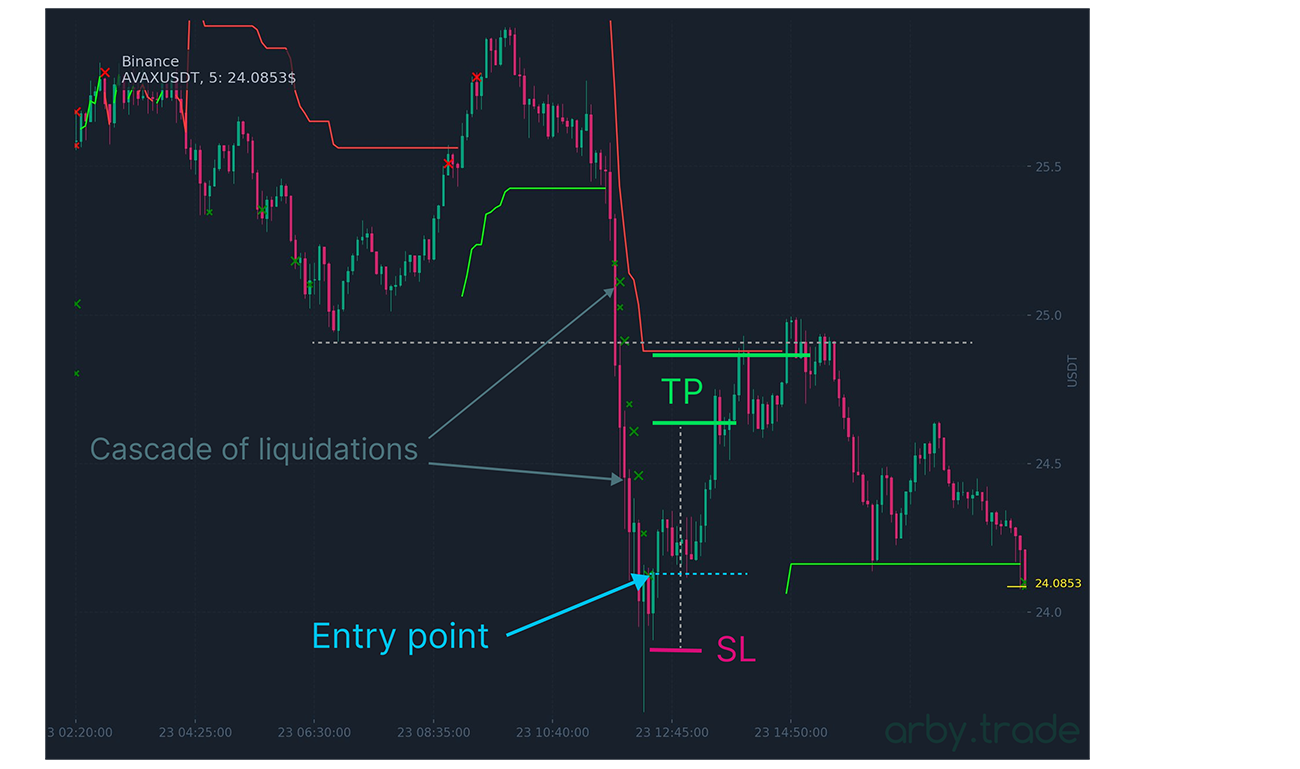
Strategy 1: Rebound After Cascade (5-min TF) + RSI
• Entry: Significant cumulative liquidation over 5 minutes + RSI < 30 (oversold). Enter on the rebound after confirmation of a green candle. If the candle on which the liquidation occurred or the previous candle broke a significant level, it is better to skip the situation, as there may be a continuation of the decline. Alternatively, you can enter the trade with a shorter stop-loss and take-profit.
• SL: Behind the recently formed low + a small buffer.
• TP: 1:2 RR, or at the nearest resistance structure, or logically when price slows and large densities appear in resistance.
• Indicators: RSI. Additional enhancer — divergence (price shows lower lows, but the indicator shows higher lows).
• Trade Duration: 5–15 minutes. Potential: if noticeable OI growth — 3–5%.
• Additional Trigger: Trading volume surge over 5 minutes ×2 from average.
• Single or Cumulative: Better to focus on cumulative liquidation volume over the last 5 minutes.
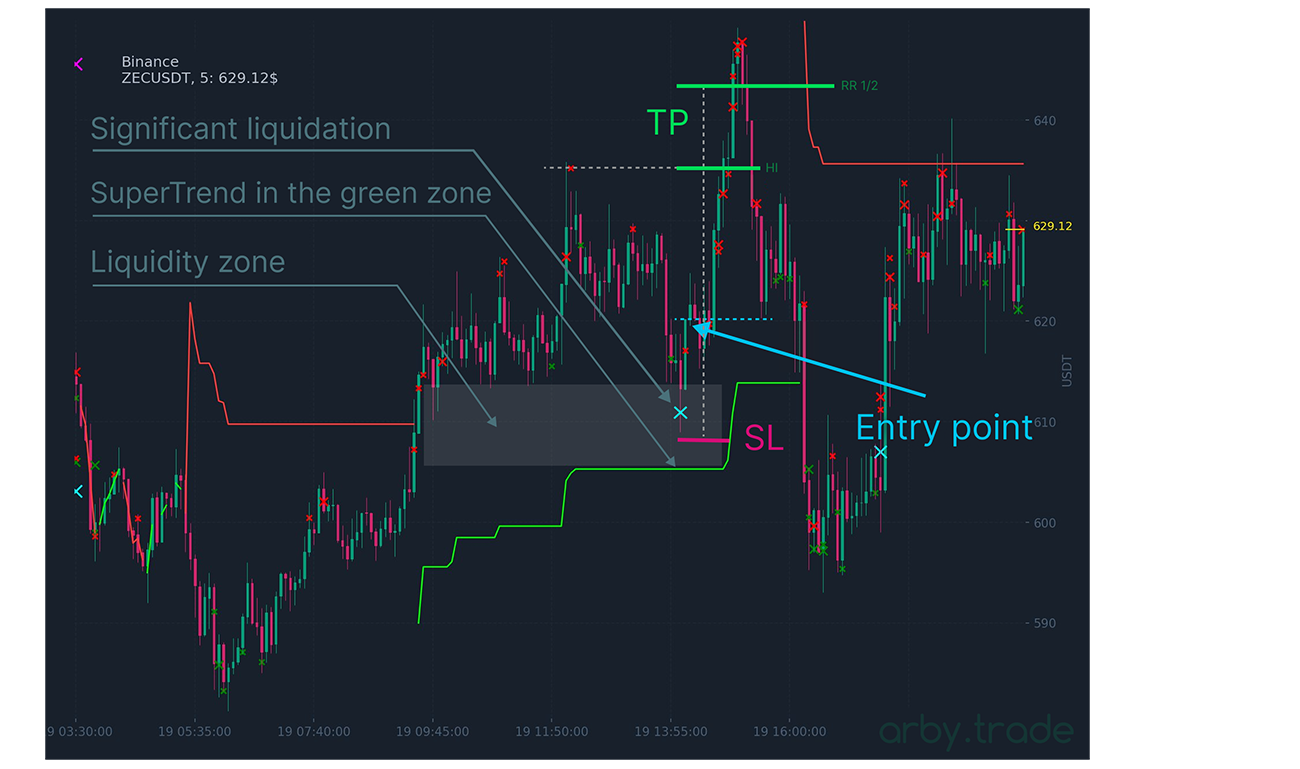
Strategy 2: Rebound Entry in Trend Direction (5-min TF) + SuperTrend
• Entry: Significant cumulative liquidation over 5 minutes + SuperTrend changes color (green for buy after short liquidations, red for sell after long liquidations) or the indicator is already in the green zone (for long) or red (for short) at the time of liquidation. Enter on the close of a bullish (for long) or bearish (for short) candle after liquidations. If the candle on which the liquidation occurred or the previous candle broke a significant level, it is better to skip the situation, as there may be a continuation of the decline. Alternatively, you can enter the trade with a shorter stop-loss and take-profit.
• SL: Behind the nearest low (high) or behind the SuperTrend line + 0.3% buffer (if the line is too close — better not to enter). The stop can also be trailed along the SuperTrend line to accompany the position.
• TP: 1:2 RR.
• Indicators: SuperTrend (settings for 5m: 25/5) + RSI in the lower part for buys (do not enter if in overbought zone) or in the upper part for sells (do not enter if in oversold zone).
• Trade Duration: 5–30 minutes. Potential: depending on liquidation volume relative to traded volume — on average 2–5%.
• Additional Trigger: SuperTrend color change + candle volume ×2 from average.
• Single or Cumulative: Better to focus on cumulative liquidation volume over the last 5 minutes.
• Win Rate: This strategy yields 65–70% win rate on volatile coins.
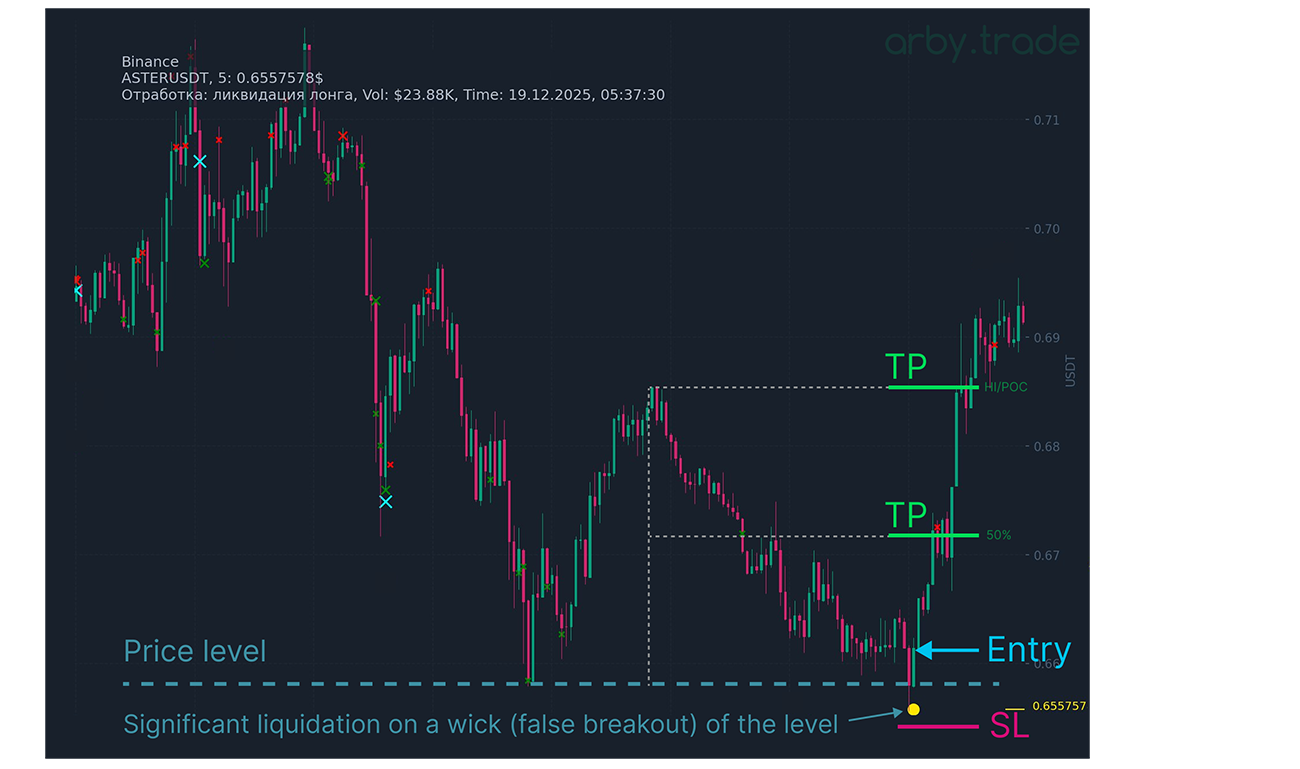
Strategy 3: Wick (False Breakout)
• Idea: A liquidation wick provides “fuel” downward, but if sellers have already been “wiped out”, the price quickly returns — often giving a short but strong rebound.
• Market Conditions: Range or local level (support/daily low/POC). No market panic (otherwise the liquidation cascade may continue).
• Entry: LONG entry only if there was a wick below the level, the candle (1m/3m/5m) closed back above the level (return above the wicked level), the next candle does not immediately break the return, but closes above the wicked level as well. + there was a noticeable liquidation or sum of liquidations.
• SL: Structural: below the wick extreme (spike low) + small buffer.
• TP: TP1 – midpoint of the range before the price wicked the level; TP2 – nearest resistance or POC.
• Trade Duration: Usually 5–30 minutes. If the price does not “come alive” in 5–10 minutes — the idea often dies, and you can exit the position.
• Single or Cumulative: Here, a single large liquidation is often sufficient + confirmation of return above the wicked level. Cumulative liquidations in this case are useful simply as a filter: “was it really a cascade or just a single large wipeout”.
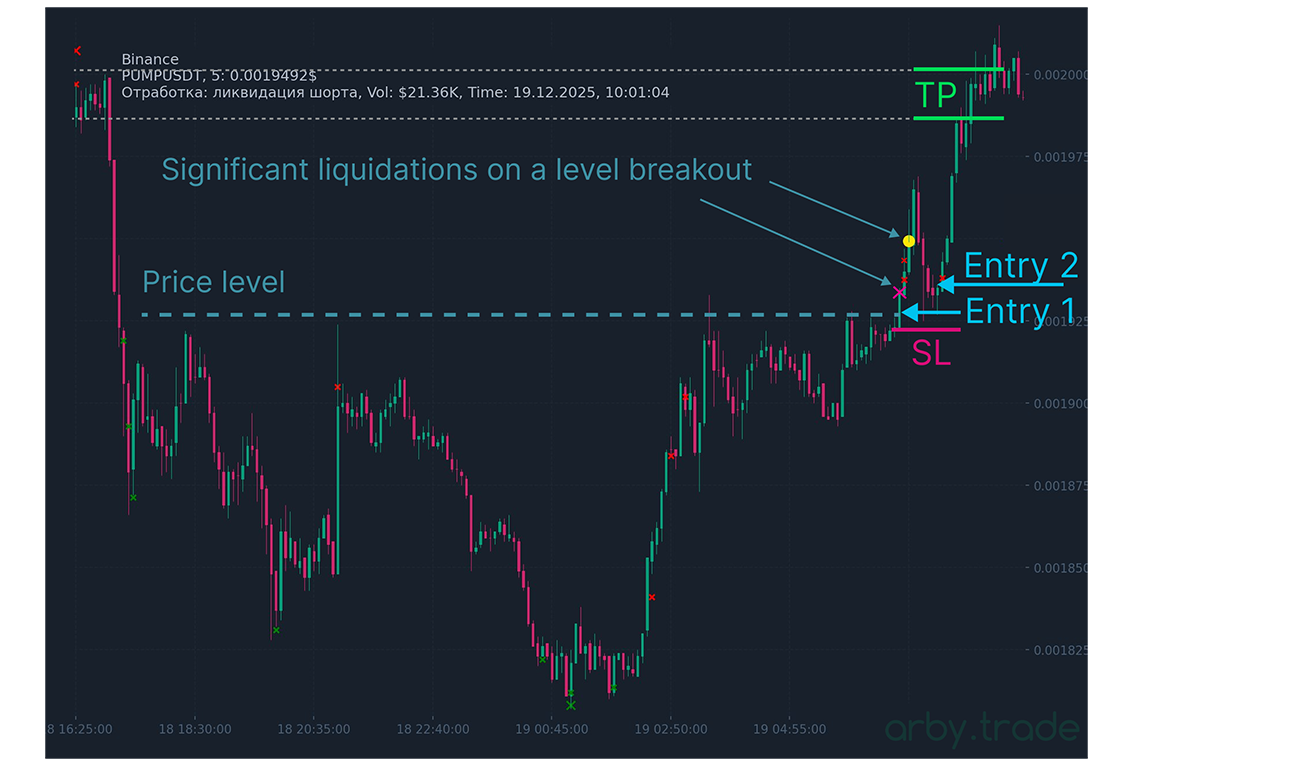
Strategy 4 — “Short Squeeze: Upward Breakout on Short Liquidations” (Continuation Trading)
• Idea: When price breaks resistance, shorts start closing. If short liquidations add up, it turns into a stream of forced buys → growth accelerates.
• Market Conditions: Clear resistance/range. Before the breakout, many people are in shorts (often visible by OI, funding, structure). Significant volumes of cumulative liquidations.
• Entry: Two options: 1) Enter immediately on breakout, but strict risk management is needed (often gets stopped out). 2) Or enter on retest of the broken level (preferred), when liquidations have already started and price has consolidated.
• SL: Below the broken level (or below the retest candle).
• TP: Either by the size of the average long move on the asset during level breakouts, or partially at upper liquidity levels, resistance, POC.
• Trade Duration: Usually 15–180 minutes
• Single or Cumulative: Both are useful here: single large short liquidations signal “acceleration started”, cumulative (5–15m) confirm that the squeeze is really “feeding”, increasing the probability of further long movement.
• Additional Trigger: Holding above the level, OI grows before breakout and then starts falling on impulse (shorts closing). Funding: if it was negative and starts moving toward zero — a sign that shorts are being “squeezed”.
It is important to understand that a liquidation or sum of liquidations alone, even significant, is not the only and sufficient criterion for entering a position. A significant liquidation is merely a primary trigger to pay attention to the situation on the coin, and then identify one of the patterns suitable for one of the strategies; if the “puzzle” fits — open the trade. Similarly, indicators cannot be the sole support in trading detached from current asset liquidity, volume surges or fades, etc. Before opening a trade, it is important to get at least 2–3 confirmations of the traded pattern, and liquidation information is a very powerful but not the only part of this “puzzle”.
7. WHICH EXCHANGE TO TRADE LIQUIDATION SIGNALS ON?
The highest quality liquidation signals come from the most liquid and popular exchanges — today these are Binance and Bybit. Price movements on these exchanges largely determine movements on other, less liquid exchanges. Therefore, it is acceptable to use liquidation signals, for example, from Binance, and trade them on any other exchange. It is only important to understand that since liquidity on this “other” exchange may be significantly lower, the price movement will not match tick-for-tick and may be more smeared, but globally the structure of the movement will be the same. Ideally, of course, trade on the exchange from which the signal came.
If for some reason you cannot create an account and trade on Binance or Bybit, you can use our referral link to register with a crypto broker, create an account on any of these exchanges through the broker, and trade using a professional trading terminal.
Here are two reliable and time-tested crypto brokers we have been working with for several years and trade ourselves using sub-accounts and their terminals: Tiger.Trade, Vataga.
8. WHERE AND HOW TO GET LIQUIDATION INFORMATION?
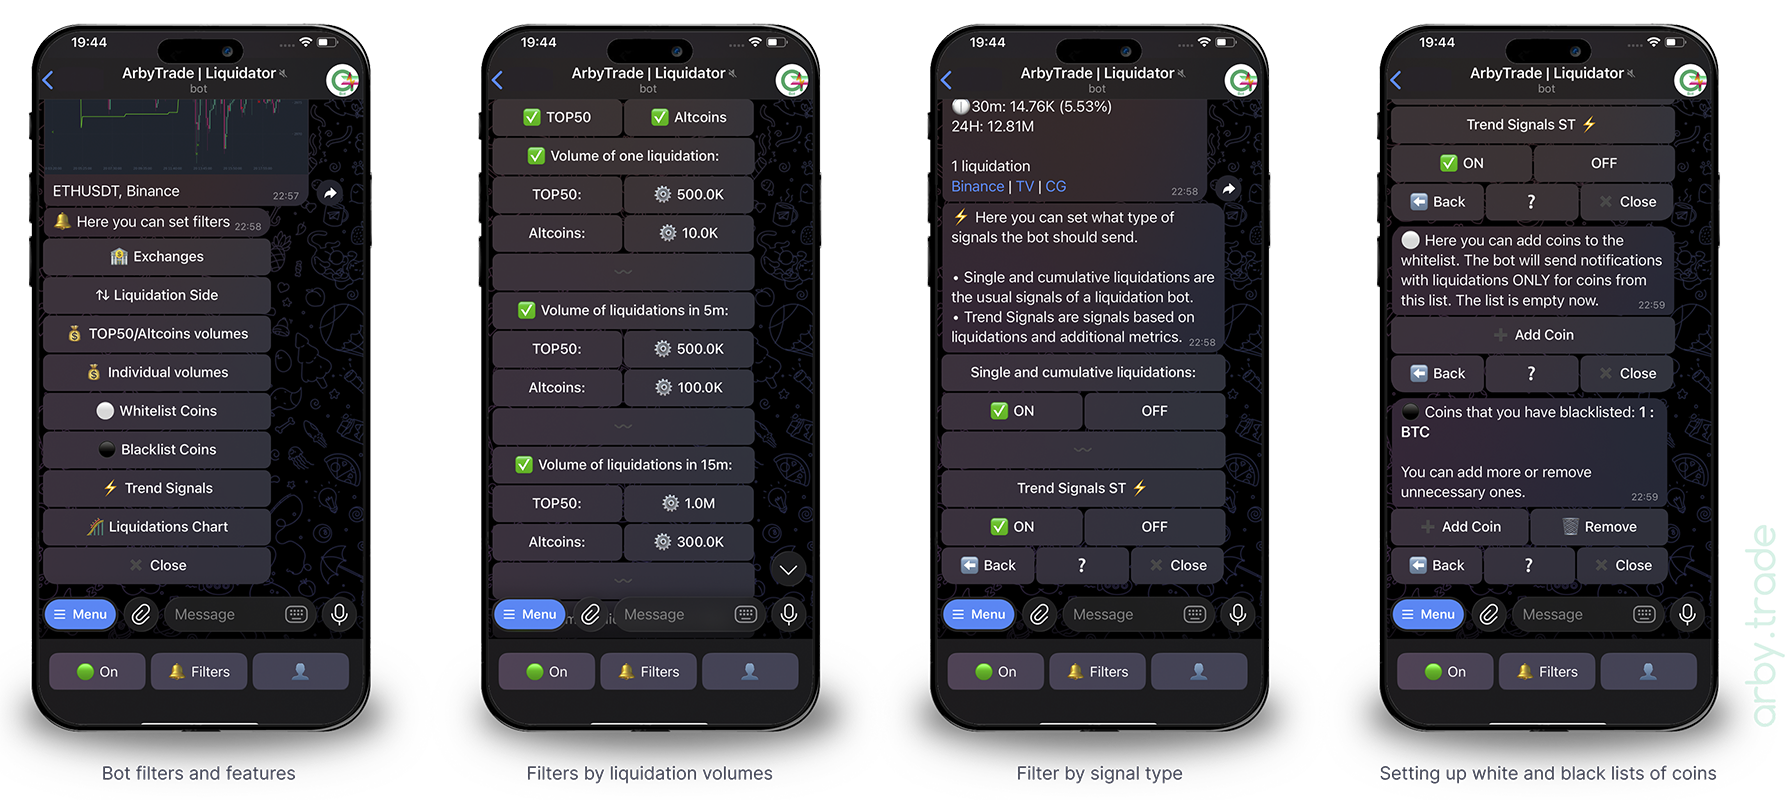
The best solution on the market at the moment is the bot @arby_liquidator_bot.
The bot sends liquidations directly in Telegram from the two most liquid exchanges — Binance and Bybit, and allows filtering signals:
• by exchanges,
• by liquidation direction (long/short),
• by coins (TOP50, alts, individual white and black coin lists),
• by volume of single liquidation, cumulative over 5, 15, 30 minutes (for each coin category),
• combine liquidations and SuperTrend indicator,
as well as allowing to see the coin chart with marked liquidations at the signal moment (indicators SMA, RSI, SuperTrend can be added to the chart right in the bot.
In fact, with the bot, you can set up a highly customized feed of your own signals in Telegram and immediately see graphically how the pattern with liquidation looks, current and cumulative liquidation volumes, previous liquidations on the chart, and make a trade decision without unnecessary jumps to third-party services and apps.
More details about bot settings and features can be found in the bot itself, and here we will just show some of its screenshots.